What You Might Be Getting Wrong About Your Pod's CPU Requests in VKS
Table of Contents
With the rise of vSphere Kubernetes Service (VKS), there are a lot of vSphere administrators who recently turned into platform engineers. While there is a certain amount of overlap between the virtual machine world and Kubernetes, there are quite a few idiosyncrasies that will catch a former vSphere administrator off-guard. CPU requests for Kubernetes Pods is one such quirk.
I’ll first explain what a CPU request actually means in Kubernetes. And then I’ll show some data from CPU stress tests that demonstrate the result of various CPU request settings in a VKS cluster.
What is a CPU Request? #
When deploying a pod in a VKS cluster, you have the option to specify resource requests for the pod’s containers. This request specifies the minimum amount of CPU or memory a container needs. Pods won’t be scheduled on a worker node unless the node has enough CPU and memory to support all of its containers.
CPU requests are formatted in two possible ways. Either as a number of cores, such as 2 cores or 0.5 cores. Or as milli-cores, where 1000m is 1 core. To keep things accessible for vSphere-focused readers, I’ll use the core format throughout this post. For example, a pod with a CPU request for 0.5 cores could look like this.
apiVersion: v1
kind: Pod
metadata:
  name: nginx-test
spec:
  containers:
  - image: nginx:latest
    name: nginx
    resources:
      requests:
        cpu: "0.5"
The Mistake #
CPU Requests Are Not Like vCPU Allocations #
If you come from the vSphere world, you might make a mistake here based on your intuition. In vSphere, you directly configure the number of virtual CPU cores a VM should have. That experience might make you think a CPU request configures the number of CPU cores a pod will have.

However, that assumption misunderstands how pods and containers work. At first glance, containers appear to be similar to VMs – discrete nodes of compute that are operating within a host. However, a container is really an isolated process in a Linux machine. And a pod is simply a group of one or more containers. Saying, “this pod is allocated 1 vCPU” makes as much sense as saying, “the web browser on this VM is allocated 1 vCPU”.
An unrestricted container could actually burst to use up to 100% of its host’s CPU resources. Like how your own machine could get bogged down if you have 100 tabs open in your web browser. When you provide a CPU request, it’s more so defining a minimum amount of CPU resources this container should have access to.
This sounds awfully like a CPU reservation in vSphere. You then learn about CPU limits, which specifies the maximum amount of CPU resources a container can use. From this new information, your intuition might shift based on your knowledge of how CPU reservations and limits work in vSphere. You might now say:
Okay, so..
- All containers can use the host’s entire CPU capacity, by default.
- A CPU request specifies the reserved or minimum amount of CPU resources for this container.
- The CPU limit defines the maximum amount of CPU resources this container can use.
- If there is no CPU limit, then the container can try to use up to the host’s total CPU capacity.
- And if there is no CPU request, then the container just uses whatever is not reserved by other containers?
This new idea is more correct, but that last assumption is what may cause issues for you. The intuition about CPU limits is pretty much accurate. Including how not configuring a limit means a container can use up to 100% of the node’s CPU resources. The mistake is that you might think the following case would happen.
CPU Requests Are Not (Exactly) Like CPU Reservations #
Consider a node with 2 CPU cores. You want to run two pods, one with a CPU request of 1.0 and the other with no CPU requests. The previous idea might make you think: The first pod is guaranteed to have access to 1 CPU core at a minimum. But the remaining CPU core would be equally shared between the two pods. That’s how it works in vSphere, ignoring things like CPU shares.
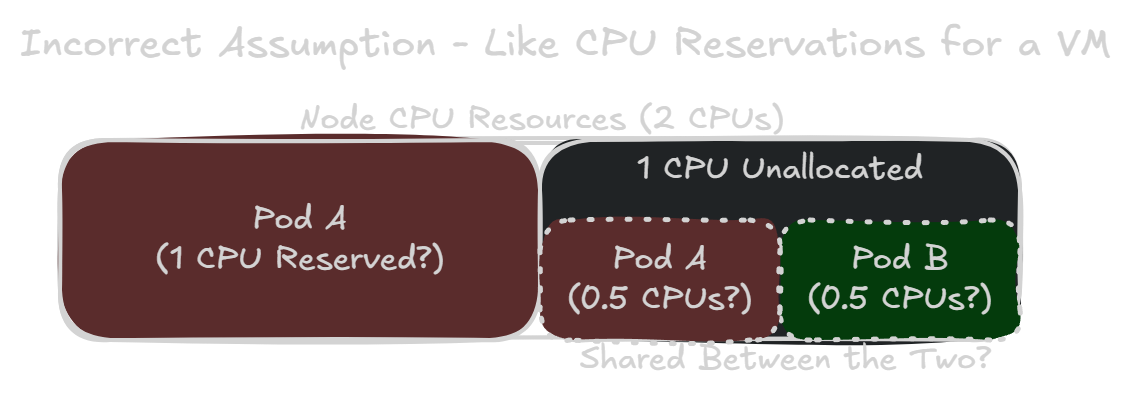
While this idea is more intuitive for someone with strong vSphere knowledge, it unfortunately could cause you to grossly under-allocate CPU resources for a pod.
How Kubernetes Actually Implements CPU Requests and Limits #
Control Groups (cgroups) #
In Kubernetes, the container runtime manages resources for containers using cgroups – a feature provided by the Linux kernel. We’re now on cgroups v2 in Kubernetes, as of version 1.25.
A CPU limit actually behaves pretty intuitively, even for a previous vSphere administrator. This limit corresponds to the cpu.max setting, which specifies the maximum amount of CPU time that a container can consume for a given interval. By default, the interval length is set to 100,000 microseconds (or 100ms). A CPU limit of 0.5 cores would correspond to a cpu.max setting of 50000 100000, meaning up to 50ms of CPU time allowed in an interval of 100ms. It essentially means this container can use up to 50% of a single core.
CPU requests are where things diverge pretty significantly from the CPU reservation assumption. A CPU request corresponds to the cpu.weight setting. This actually defines the CPU priority of the container, not necessarily the guaranteed minimum amount of CPU resources. It’s more similar to the CPU shares concept in vSphere. In fact, cgroups version 1 had this as a cpu.shares setting instead.
To determine the cpu.weight value for a container, the container runtime uses a formula to “convert” a CPU request value into a weight. In runc version 1.3.4+vmware.1-fips, a container with a CPU request of 1.0 is given a cpu.weight of 100.
Pods are also given cpu.weight and cpu.max settings based on the limits and requests for their containers. These settings dictate a pod’s quality of service (QoS) class. Right now in VKS version 1.35.0+vmware.2, a pod’s cpu.weight is still calculated with the old formula, resulting in different weights from the underlying containers. But this will likely change to the new formula in a future release. However, for this post we will use the weights as calculated for the pods, such as a request of 1.0 equaling a cpu.weight of 39.
Pod Quality of Service Classes #
If a pod has a container with a resource request or limit, it’ll be given a Burstable QoS class. Pods with no resource requests or limits are given the BestEffort QoS class. Finally, if every container in a pod has CPU and memory requests with a matching limit, it’s given a Guaranteed QoS class.
Since we’re only focused on CPU resources and not on memory or evictions, we won’t discuss Pod QoS classes beyond this. You can read more about Pod QoS classes on your own here: Pod Quality of Service Classes - Kubernetes Documentation
CPU Resource Sharing With All Burstable Containers #
Although a CPU request actually specifies a CPU priority, the intuitive idea that a CPU request is like a CPU reservation does hold up for the most part. The Kubernetes scheduler takes a node’s total CPU resources into account when deciding where to place a pod. And the scheduler won’t place a pod on a node if it doesn’t have enough unallocated CPU resources to support a container’s CPU request.
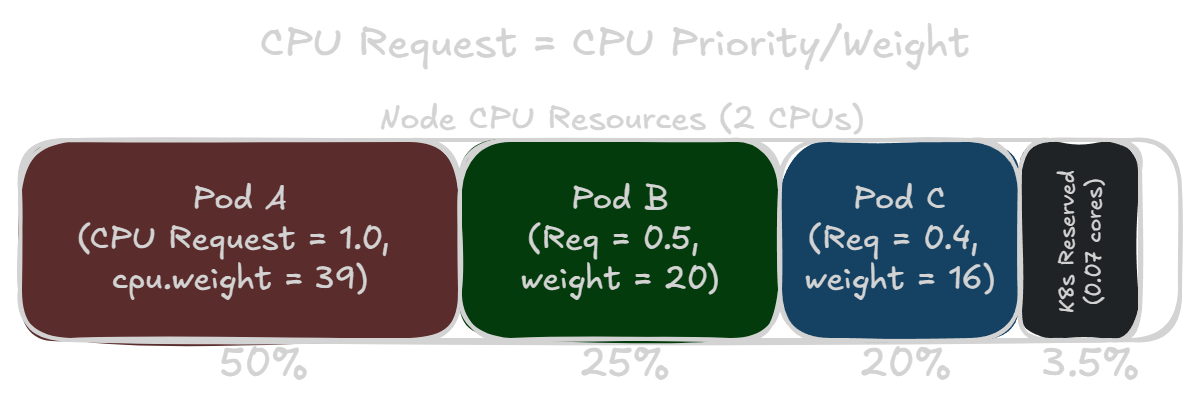
This means if you have a node that’s completely allocated, a pod’s CPU weight compared to the sum of all weights on the node would be about the same ratio as the amount of CPU resources it requested. If all pods are working at 100% load, then the CPU time scheduled for each pod should just about match their requested amount of CPU.
CPU Resource Sharing With a Best Effort Container #
If you don’t specify a CPU request or limit for a container, it’s given a cpu.weight of one (1). The lowest possible weight and CPU priority. This means the container and pod will be given CPU resources very much on a best effort basis. If you have a best effort pod and another pod with any CPU request, the best effort pod will receive almost no CPU resources until the other pod no longer requires the CPU.
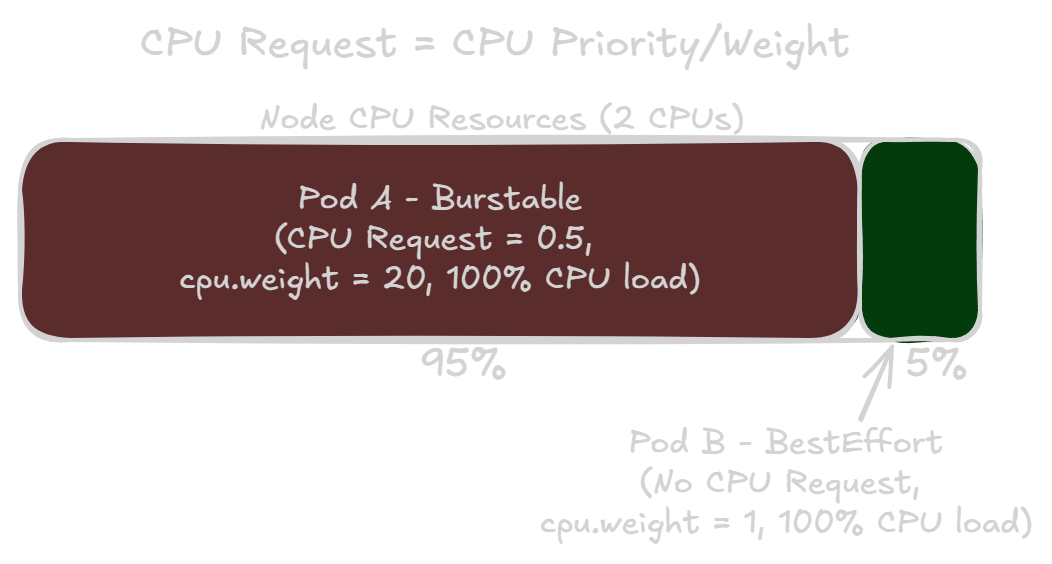
Unlike CPU reservations in vSphere, a higher CPU request in Kubernetes means that pod has a higher priority for all of its CPU usage. Not just for the amount in the CPU request.
The Kubernetes cgroups Hierarchy #
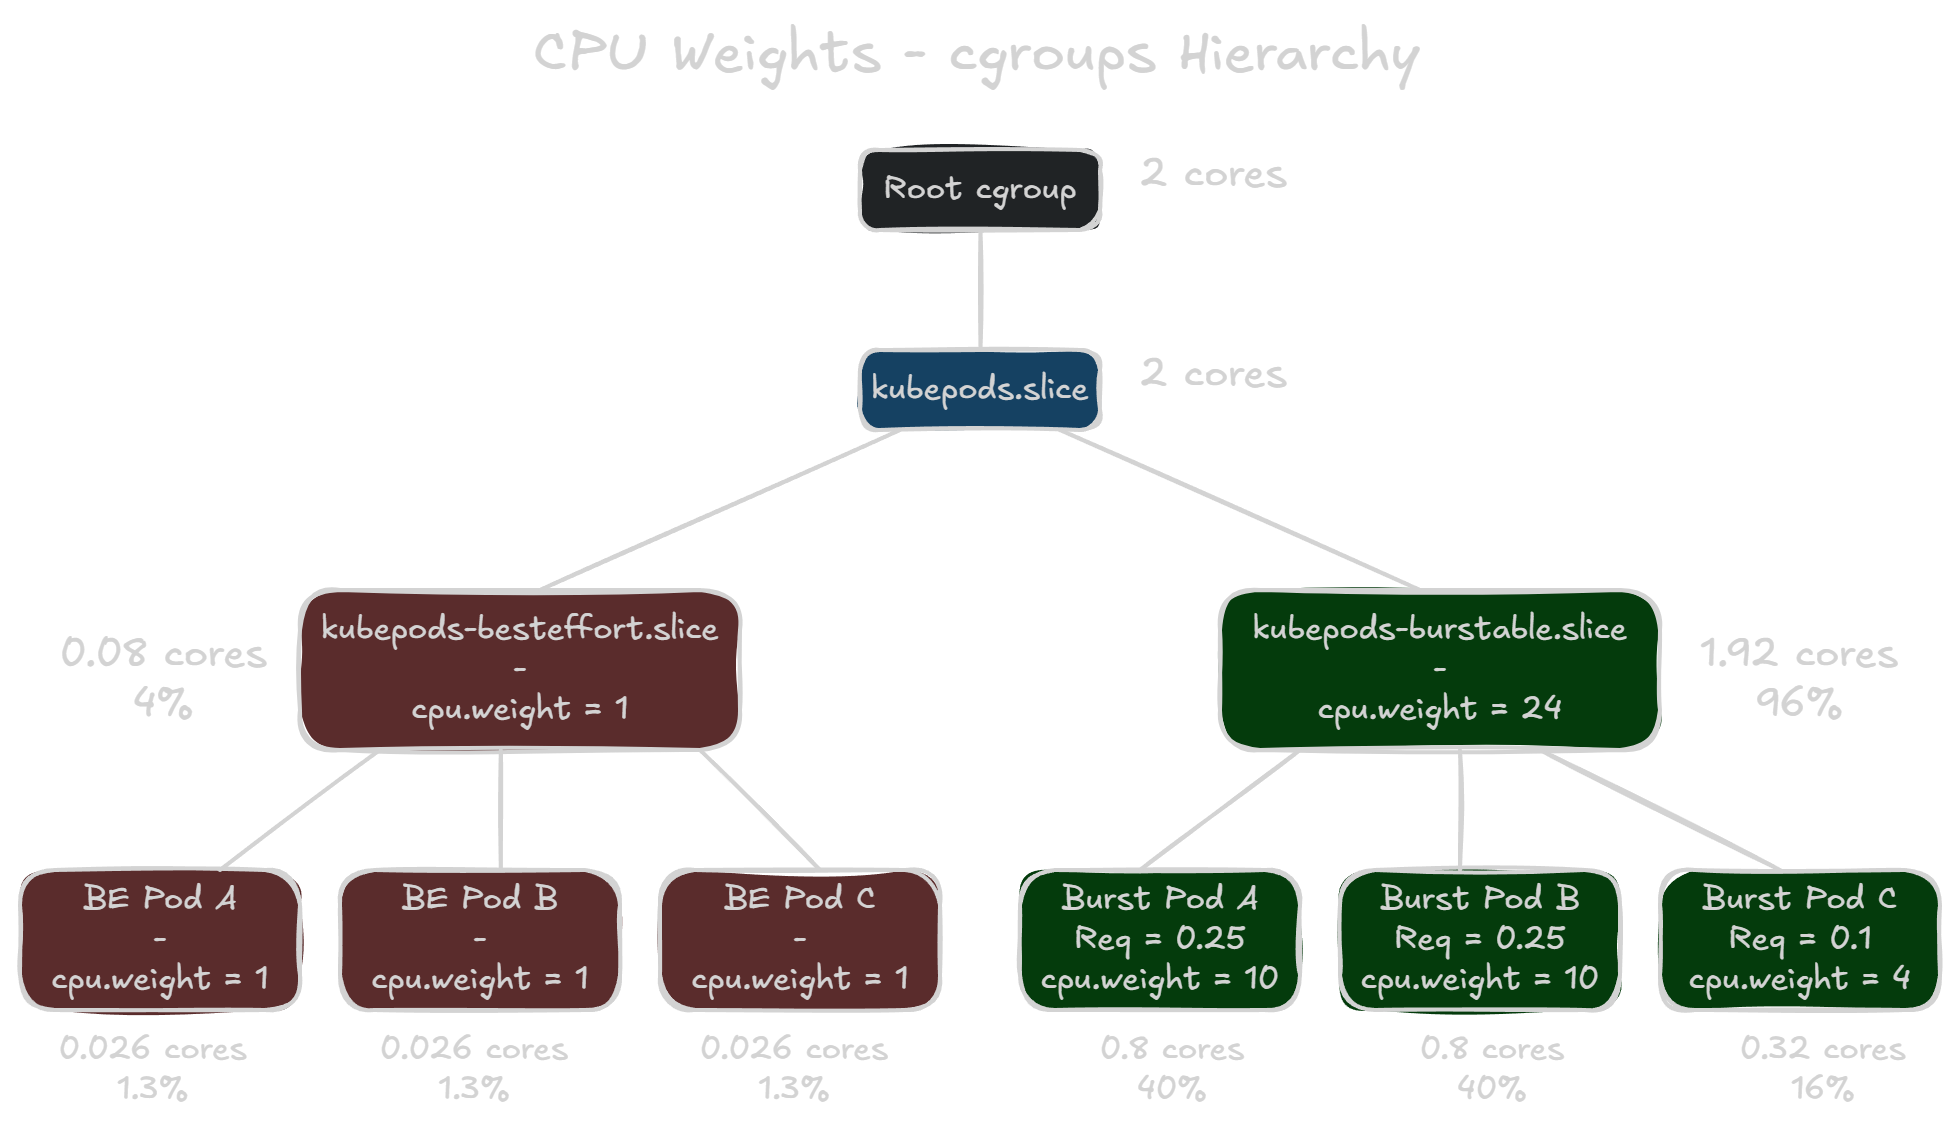
If you SSH into a VKS node, you can view the actual cgroup settings for the pods. VKS clusters have the pod cgroups located in /sys/fs/cgroup/kubepods.slice. When you navigate to this directory, you’ll notice two more directories: kubepods-besteffort.slice and kubepods-burstable.slice. These are subtrees based on Pod QoS classes that contain the subgroups for each pod on the node. And then each pod’s subgroup also contains sub-subgroups for their respective containers.
It’s important to note that the subtrees also have cpu.weight assignments. The weight of kubepods-burstable.slice is the total sum of all weight values for burstable pods. However, kubepods-besteffort.slice has a weight value of one (1), no matter how many best effort pods are on the node. The priority of CPU resources is divided up at each level of the hierarchy. So in the example below, all best effort pods are only guaranteed a minimum of 4% of total CPU resources, with each of them only guaranteed 1.3% of the total. This is because the kubepods-besteffort.slice is competing with a weight of 1 against the kubepods-burstable.slice with a weight of 24.
CPU Stress Test Results #
To see how much CPU time pods actually get based on their CPU request values, I deployed some CPU stress test pods in my VKS cluster. I built a Debian container image with stress-ng, which runs a CPU stress test using the following parameters: stress-ng --cpu 0 --cpu-method pi --timeout 5m --metrics. Finally, I specified the same nodeName in the pod specification to ensure everything runs on the same node. It’s also important to note that the worker nodes in this VKS cluster all have two (2) vCPUs. And two pods for the Antrea and Contour services are running on all nodes, which request a total of 0.4 CPU cores off the bat.
Equal CPU Requests #
I first tested two cases where two pods have the same CPU requests. One where both pods are best effort and another where they both have a CPU request of 0.1. The results were about as expected: both pods received around the same amount of CPU time.
| Pod | CPU Request | cpu.weight |
CPU Time (sec) | Ops Per Sec | CPU Used (%) |
|---|---|---|---|---|---|
| best-effort-1 | None | 1 | 296.65 | 1253.81 | 49.47 |
| best-effort-2 | None | 1 | 293.50 | 1240.63 | 48.95 |
| Pod | CPU Request | cpu.weight |
CPU Time (sec) | Ops Per Sec | CPU Used (%) |
|---|---|---|---|---|---|
| burstable-1 | 0.1 | 4 | 294.88 | 1229.60 | 49.18 |
| burstable-2 | 0.1 | 4 | 294.91 | 1229.64 | 49.18 |
Best Effort vs Burstable (0.1 cores) #
Next, I tested how a best effort pod fares against a burstable pod with a CPU request for just 0.1 cores. The former vSphere administrator assumption says the burstable pod is guaranteed the first 0.1 cores, but then it’ll be shared equally after that. So maybe 45% vs 55% in burstable pod’s favor? However…
| Pod | CPU Request | cpu.weight |
CPU Time (sec) | Ops Per Sec | CPU Used (%) |
|---|---|---|---|---|---|
| best-effort | None | 1 | 26.88 | 113.77 | 4.48 |
| burstable | 0.1 | 4 | 563.46 | 2386.36 | 93.96 |
What actually happens is the burstable pod receives over 19 times more CPU resources than the best effort pod! Even though the burstable pod only requests 10% of a single core, which is 5% of the worker node’s total CPU capacity. And no, I did not accidentally label the pods in the wrong order.
You might ask why does the best effort pod not receive 20% of the CPU? The burstable pod only has a weight 4 times larger than the best effort pod. Well, the reason is the two other pods on the node that support Antrea and Contour services. These each have a cpu.weight of 8, which adds 16 to the total weight for the burstable pods subtree. If you recall how the cgroups hierarchy works, the best effort pod is actually competing against a weight of 20. This explains how the burstable pod received over 19 times more CPU resources, despite only having a weight 4 times larger.
Best Effort in a Fully-Allocated Node (4x Burstable Requesting a Total of 1.5 cores) #
Let’s see how a best effort pod fares when placed with four other burstable pods who have CPU requests that almost take up the node’s total CPU capacity. It doesn’t quite add up to the node’s total CPU capacity (2 vCPUs) because of the Antrea and Contour pods and the 0.07 cores of Kubernetes overhead.
| Pod | CPU Request | cpu.weight |
CPU Time (sec) | Ops Per Sec | CPU Used (%) |
|---|---|---|---|---|---|
| best-effort | None | 1 | 7.14 | 29.96 | 1.19 |
| burstable-1 | 0.25 | 10 | 96.71 | 406.70 | 16.13 |
| burstable-2 | 0.25 | 10 | 96.69 | 406.74 | 16.13 |
| burstable-3 | 0.50 | 20 | 194.70 | 1260.85 | 32.47 |
| burstable-4 | 0.50 | 20 | 194.03 | 1261.08 | 32.36 |
All of the burstable pods got their minimum CPU requests. If you’re confused about 16.13% being less than 0.25 cores, stress-ng calculates the CPU used % based on all available cores. The worker node has two vCPUs so just double the CPU used % to see how much of the total CPU capacity the pod got.
But as we can see, the best effort pod received scraps. Best effort CPU priority really means best effort. Even though the best effort pod wanted as much CPU as it can use, it only got 1.19% of the total CPU capacity. All of the burstable pods had significantly higher priority to the CPU scheduler, so they got what they needed first.
When to Use a Best Effort Pod #
This isn’t to say you should avoid a best effort pods at all costs. The vast majority of the time, a pod is not attempting to use as much CPU as it can. Consider a case where a best effort pod is competing with a burstable pod that requested 0.5 cores and is actively using 0.8 cores (or 40%) of CPU resources. I added the --cpu-load 40 flag to the burstable container’s stress-ng parameters.
| Pod | CPU Request | cpu.weight |
CPU Time (sec) | Ops Per Sec | CPU Used (%) |
|---|---|---|---|---|---|
| best-effort | None | 1 | 334.55 | 1382.40 | 56.34 |
| burstable (40% CPU Load) | 0.5 | 20 | 242.62 | 992.91 | 41.63 |
You can see that the burstable pod gets what it needs – a little more than 0.8 cores or 40% of total CPU capacity. Meanwhile, the best effort pod is able to use whatever CPU resources were remaining. In this case, there was a sizeable amount of unused CPU resources for the taking.
If you have a low-priority workload that can be safely interrupted, a best effort pod is perfect for that. It’s also useful to ensure a low-priority pod won’t starve out any critical workloads that have CPU requests, even if it attempts to run at 100% CPU load. So the purpose of this post isn’t to shoo people away from best effort pods. It’s just an admonition for people who might be approaching resource management in VKS clusters the same way they approach it in vSphere.
But if you want to ensure a workload will always have its necessary CPU resources, you must assign it a CPU request.
vSphere Pods #
As an aside note, since we’re in the VKS and vSphere Supervisor world, this quirk doesn’t affect vSphere Pods in the same way. Because vSphere Pods run in a lightweight VM, that Pod VM is allocated a specific amount of vCPU and memory by vSphere. By default, it is 1 vCPU and 512 MB of memory, according to Vino Alex.
A best effort vSphere Pod won’t be starved out of CPU resources like a normal best effort pod would. That’s because the vSphere Pod is always allocated at least 1 vCPU. However, this means a vSphere Pod also cannot burst to use its host’s entire CPU capacity. If you need more CPU or memory resources for a vSphere Pod, you’ll need to add resource requests to the vSphere Pod’s definition.